
2つの引数をもつ関数は、三次元プロットで可視化できます。これを紙面やPDFに表現するのは、やや難しくなります。投影や視点、角度を設定する必要があり、奥行きがあるため、一部は隠れ、他の部分は前面に表示されるようにしなければなりません。 ここでは pgfplots パッケージを使用して、f(x,y) = sin(x)*sin(y) をプロットします。
実践レシピ集

数学のよく知られた古典的分野の一つに幾何学があります。学校で、コンパスと定規による作図を行うユークリッド幾何学を学んだことがあるでしょう。数学の教師にとって、幾何学的な作図やその説明を描くことは大きな関心事かもしれません。基本となる作図は、見た目が幾何学的でなくても、直線や円の交点や接線が必要な一般的な図を描く際にも役立ちます。 ここでは、学校で習った幾何学の作図を思い出してみましょう。TikZの上で動作する tkz-euclide パッケージを使用します。

Commutative diagrams can become complicated. They can have many columns, many rows, and a lot of arrow and labels. In such cases, for loops and…

In algebra, especially in category theory, we use so called commutative diagrams. Vertices denote objects such as groups or modules. Arrows represent morphisms, which are…

In a complex formula or equation, it can be useful to emphasize a specific part. We can achieve this, for example, through highlighting by color…

We will use pgfplots for a three-dimensional plot of an exponential function. We will apply a style for reduced and shifted axes, to get a…

The standard pgfplots axis environment is used for Cartesian coordinates. However, pgfplots provides also logarithmic axes and polar axes. Functions can also be defined in…

We plot a sine function with PGFplots, similar to: http://latex-cookbook.net/cookbook/examples/grid-plot/ While a grid and a lot of ticks can be useful to inspect specific values…
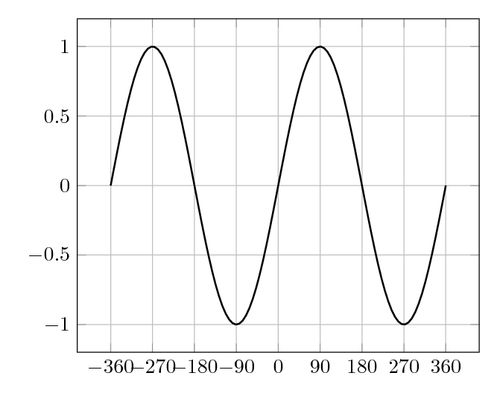
We will plot a sine function with PGFplots. A default pgfplots axis will be rectangular box that contains the plot. Let’s look at this. In…