

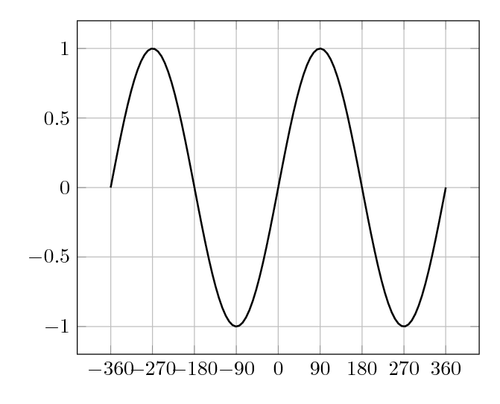
We will plot a sine function with PGFplots. A default pgfplots axis will be rectangular box that contains the plot. Let’s look at this. In addition, we will add a grid, and we will choose the places for the axis ticks with labels.
The code, and more, is explained in the LaTeX Cookbook, Chapter 10, Advanced Mathematics, Plotting functions in two dimensions.
% Plotting a function with a grid
% Author: Stefan Kottwitz
% https://www.packtpub.com/hardware-and-creative/latex-cookbook
\documentclass[border=10pt]{standalone}
\usepackage{pgfplots}
\begin{document}
\begin{tikzpicture}
  \begin{axis} [grid, xtick = {-360,-270,...,360}]
    \addplot [domain=-360:360, samples=100, thick] { sin(x) };
  \end{axis}
\end{tikzpicture}
\end{document}
Overleafで開く: grid-plot.tex