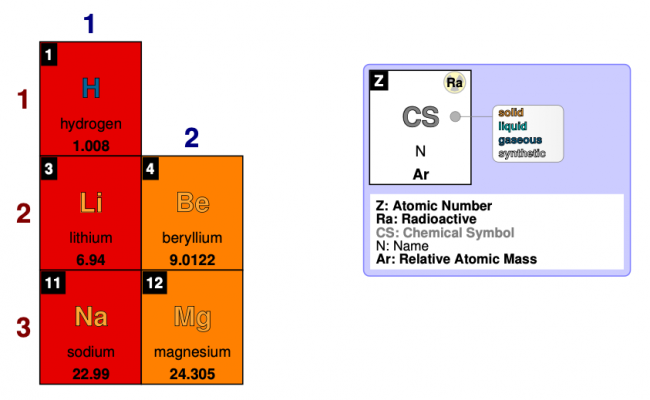
元素周期表は、すべての既知の化学元素を原子番号やその他の性質に基づいて整理した大きな表です。似た性質をもつ元素を同じグループにまとめることで、それらの関係をひと目で分かるようにしています。
実践レシピ集
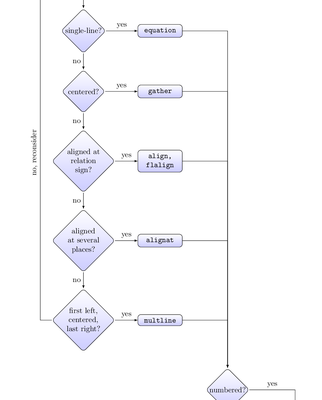
フローチャートは、処理の流れや手順を図で表したものです。開始点から各ステップへと進み、条件分岐や処理を経て最終的な結果へと至ります。アルゴリズムや業務手順を分かりやすく説明するのに役立ちます。
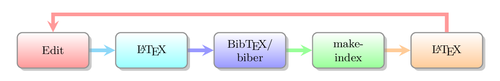
A flowchart showing a common TeX workflow, using the smartdiagram package. Full explanation in Chapter 9, Creating Graphics: Building smart diagrams % A flowchart of…
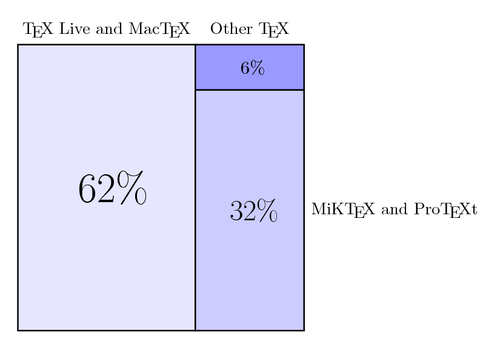
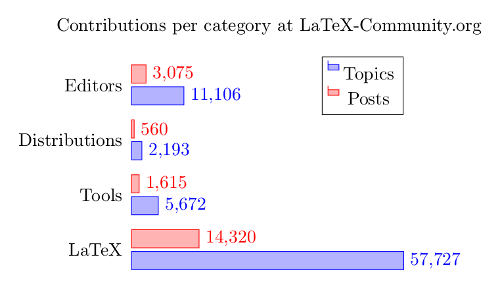
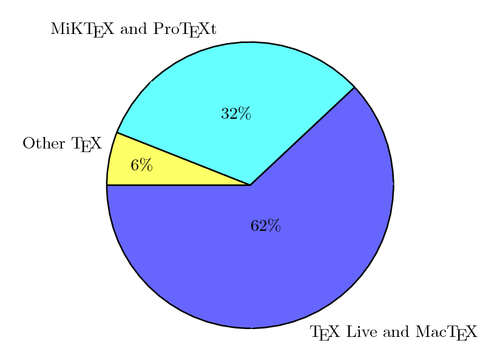
Pie charts are popular for showing proportions. A pie chart’s main characteristic is that all items usually sum up to 100 percent. We will use…
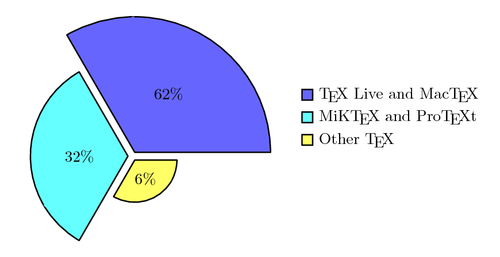
Pie charts are popular for showing proportions. A pie chart’s main characteristic is that all items usually sum up to 100 percent. We will use…
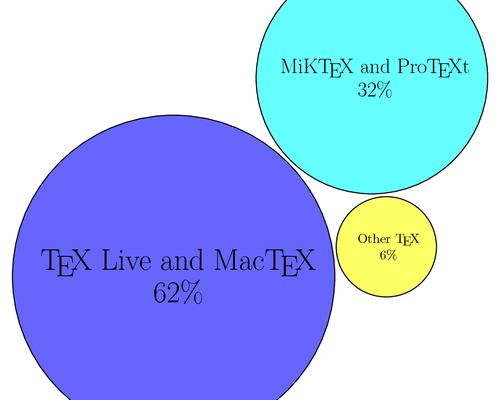
Pie charts are popular for showing proportions. A pie chart’s main characteristic is that all items usually sum up to 100 percent. We will use…